As a designer, being able to fetch real data from an API is empowering. This simple tutorial tells you how you can do it and use the data in your Figma prototype. We fetch real-time weather data from the AccuWeather API, process it in Google Sheets, and populate a Figma prototype with the data.
This tutorial is based on my lecture at LAB University of Applied Sciences, initially targeted at design students who want to learn about technology. It will teach you:
- How to use the handy API Connector tool
- How to manage data in Google Sheets and populate your Figma designs with that
- How the APIs often don’t provide you with the data in the optimal format but you need to process it further before using it. Now, real developers don’t do this in Google Sheets but the toolset presented here lets you build this end-to-end without knowing how to write a line of code.
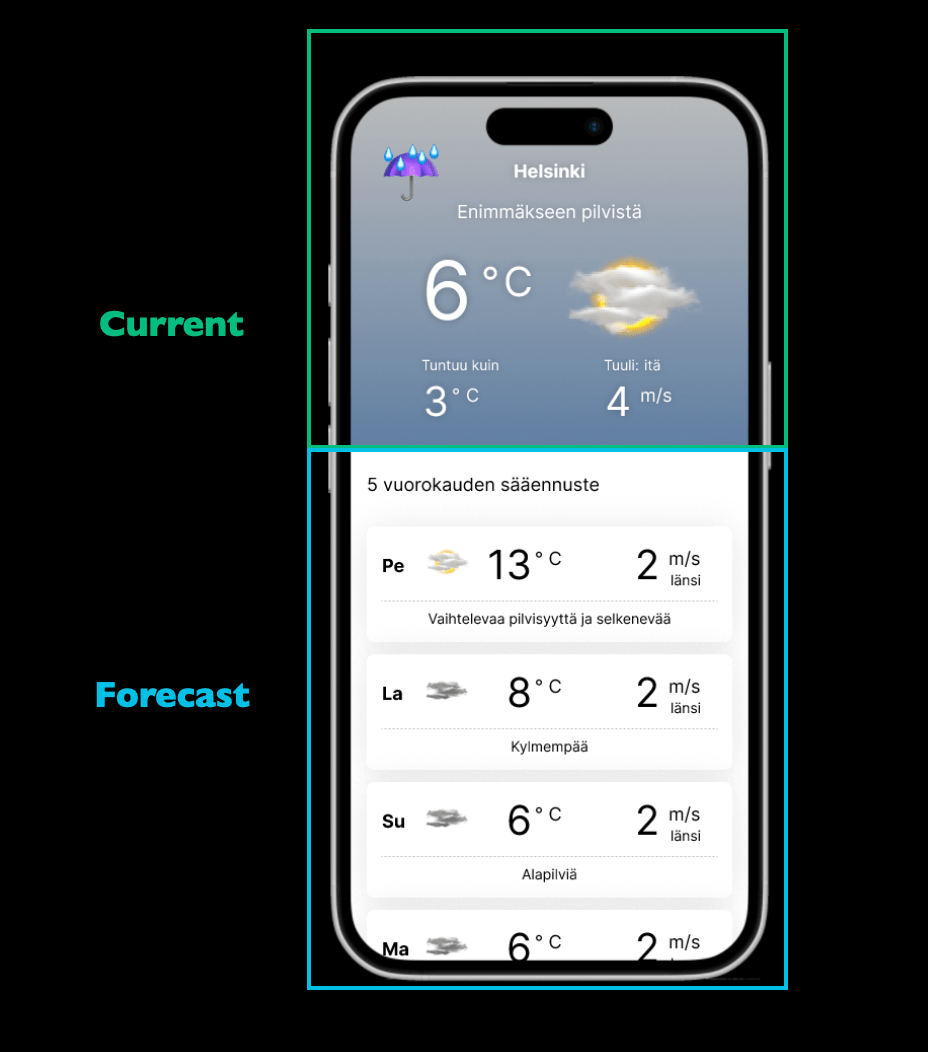
This prototype is what we end up creating in this tutorial. There’s nothing special in the design but the point is that it is populated with real data.
Preparations
Install the Mixed Analytics plug-in to your Google Sheets. The free version will be enough for this tutorial.
Get the Google Sheets Sync plug-in to your Figma. There are other similar plug-ins as well but this one seems to work better with images.
Follow the instructions and create a free account for AccuWeather. Having done that, follow the instructions and create an app in AccuWeather. NB When creating the app, be careful to only choose the Core Weather product.
If you add MinuteCast as well, AccuWeather seems to disable your access to the Core Weather service even if the UI shows that they are both selected.
Finally, create a new Google Sheets document.
Fetching data into Google Sheets
Let’s take a look at what we try to accomplish here first. You can also take a look at the prototype.
At the top of the view we have the current weather status, at the bottom we can see a five-day weather forecast.
Current weather
Let’s fetch the current weather first. Start by naming the first sheet in your Google Sheets document Locations. (The names do not matter but it’s easier to follow if you follow the naming scheme I used.)

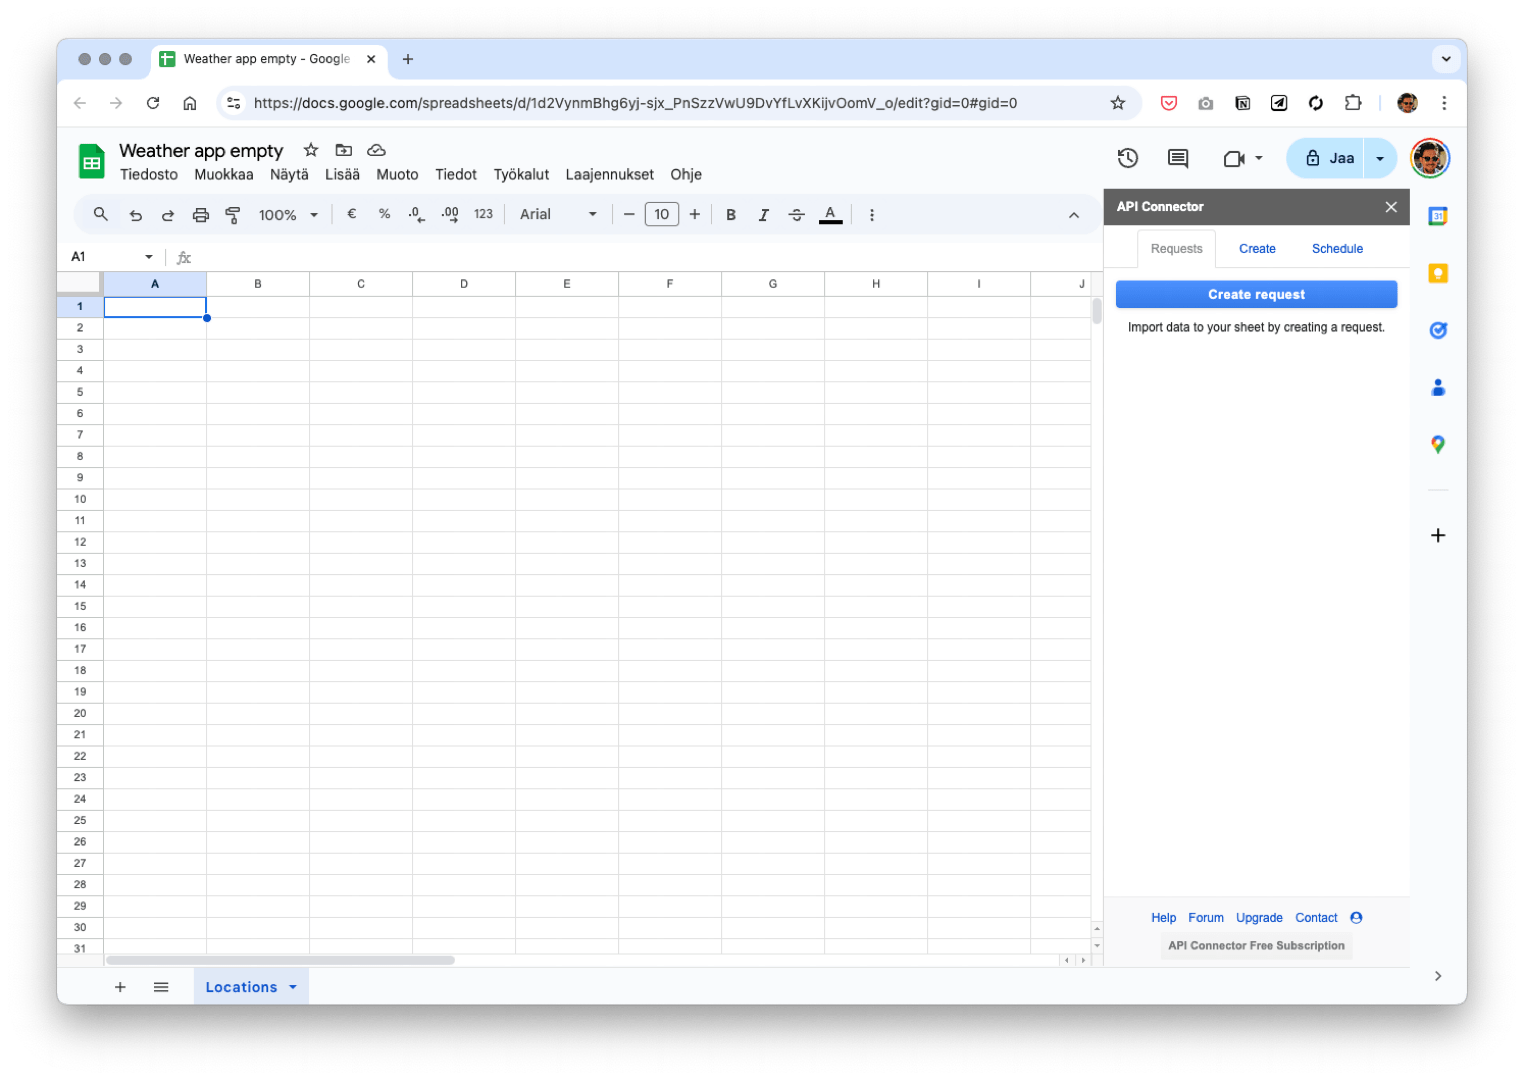
Open the API Connector plug-in

API Connector opens to the right side of the window. Press Create request to start.
API Connector happens to support AccuWeather directly. It makes authentication easier and saves you from writing the correct requests by hand. That’s why AccuWeather was chosen for this tutorial.

Next up, we choose the API endpoint we want to connect to. You can see that there is a promising endpoint with the title Get current weather conditions. However, it has locationKey as its parameter and we don’t know it yet.
Hence, we need to start with the endpoint Search locations by name.

We need to authenticate to use the API. AccuWeather data is hardly confidential but they want to control that free tier users only get the service they pay for. Typically, you don’t authenticate to APIs with a username and a password but rather use a unique API key that the target service generates you. You were given your key when you created your app inside AccuWeather. Copy paste the key here.
For increased security, many services only let you see the API key one time when you generate it and after that, it’s up to you to take care you have it stored somewhere. AccuWeather is more liberal here and lets you see your key in the profile indefinitely.
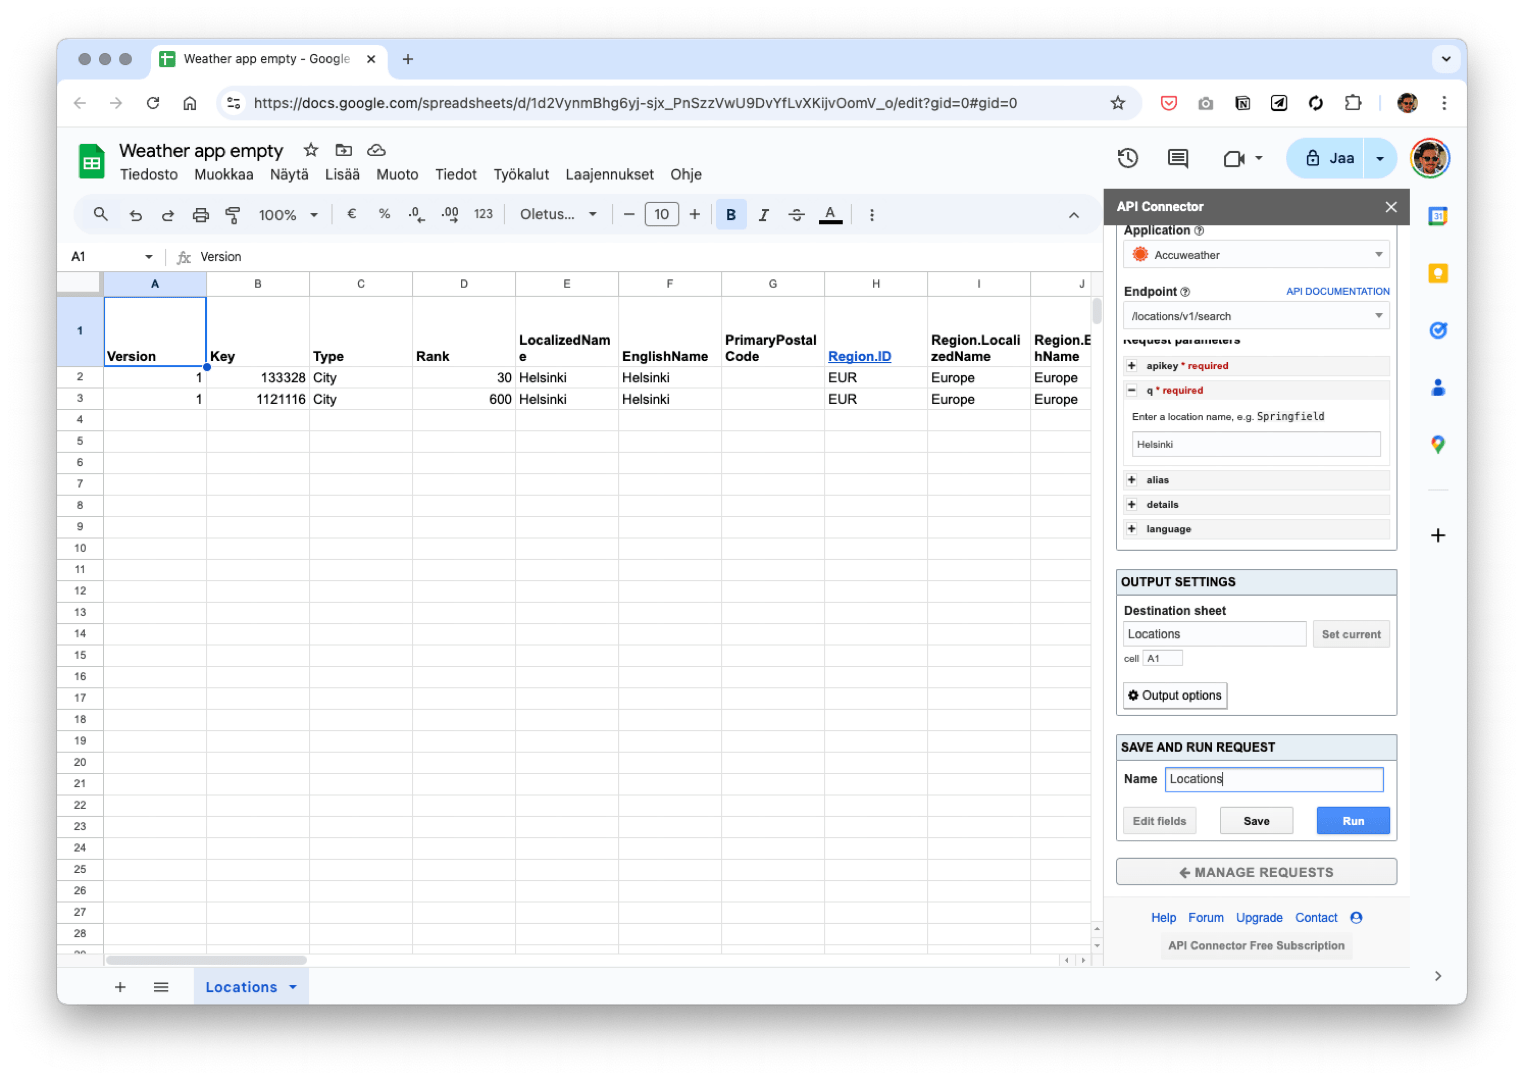
Another thing you need to enter is the name of the location you are interested in. I use ”Helsinki”.

You still need to define where you want to store the data that will be fetched. Click the cell A1 in the sheet Locations and press the Set current button. It’s generally a good idea to fill the sheet starting from A1.
Sometimes you may want to do some calculations and reserve room for them and hence start from another column. By pressing the Output options button you can control some further options.
Now it’s time to try out if the request works. Hit the Run button in the bottom right corner.

We see that we got two different results for Helsinki. Scrolling the table sideways you see that they are from different locations. Either one is close enough for our purposes. We use the first result and you can find the locationKey in the cell B2.

Now is a good time to save your request. In the image I used the name Locations. Give the name, press save and exit the request editor by pressing Manage requests.
Probably it would have been better to say Get Locations to be more clear.
Let’s start creating the actual request for getting the current weather data now that we have figured out the key. Let’s start by duplicating the previous request. This will ensure that we have the authentication working right away.

Choose the Get current weather conditions as your endpoint. Below, you are shown how you would write the request if API Connector didn’t have ready-made support for AccuWeather.

Copy the locationKey from the cell B2 and paste it inside the field on the right.

Before you run your new request, pay attention to where you are writing the data. Since the original request was duplicated, you are about to overwrite your existing data. Create a new sheet and call it Current. Focus the A1 cell in the sheet and click the Set current button. Now you can run your request.

The data starts flowing in. Magical! Now is a good time to give your requests a name and save it.
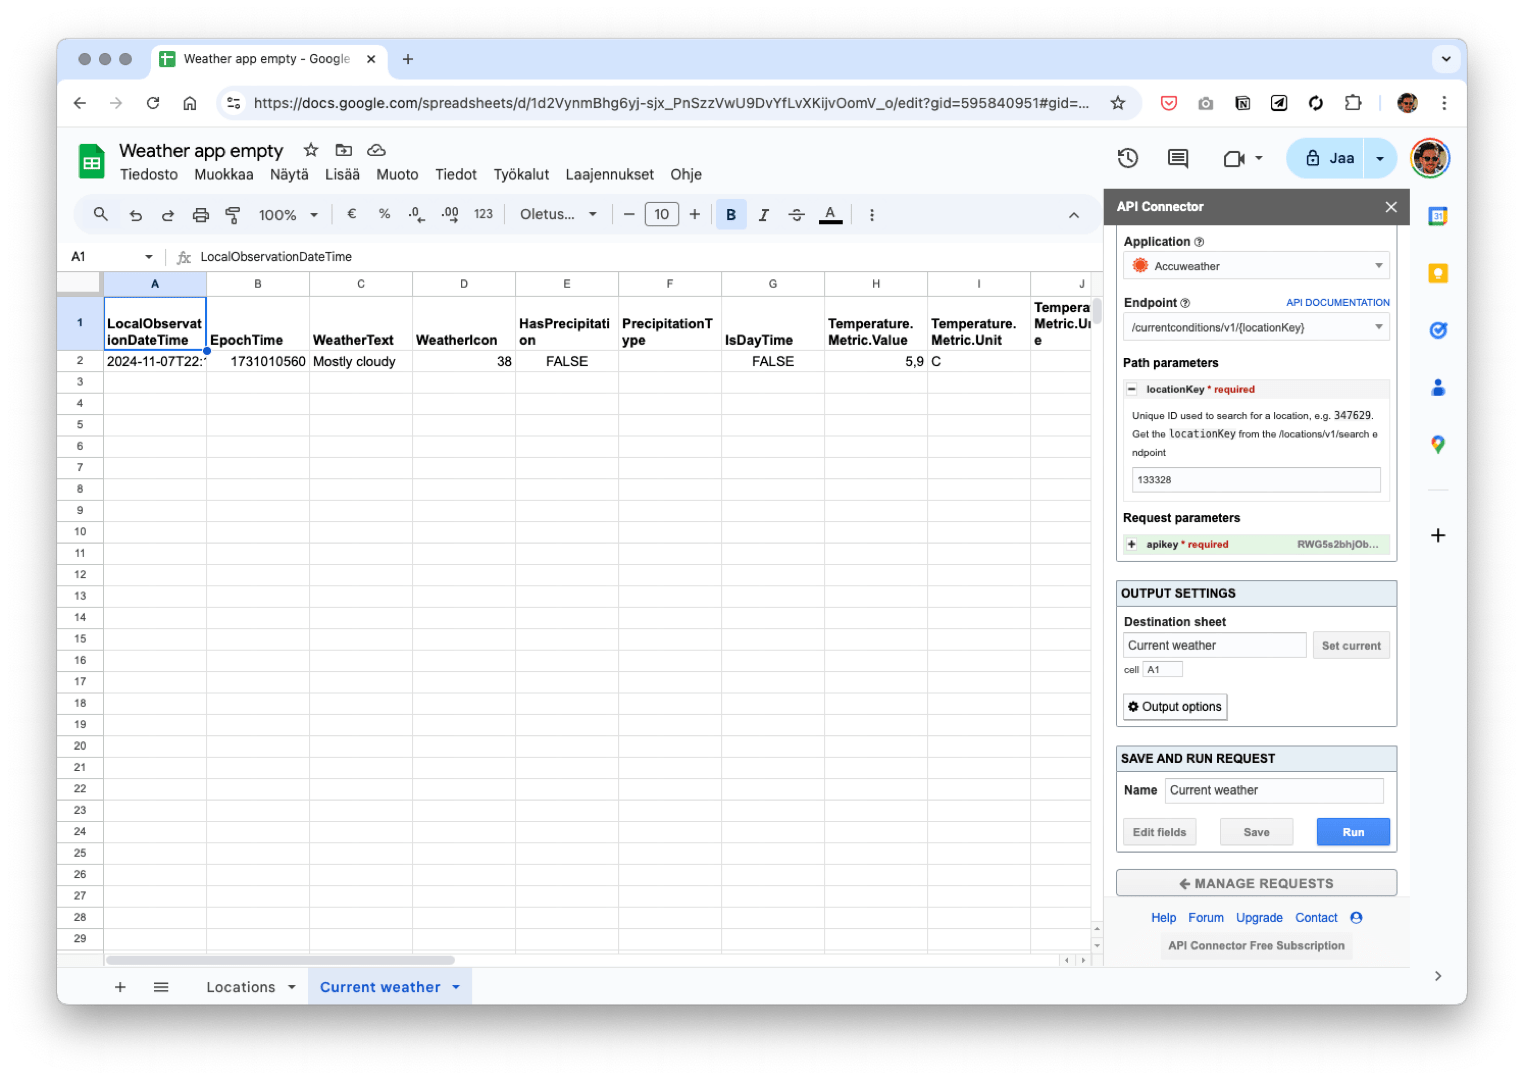
Once you have recovered from the astonishment, you can take a look at the data you got. Most of the titles on row 1 are pretty easy to interpret. But the data seems to be in English. What if we wanted to get the verbal description in Finnish instead?
You can see that there is an optional language parameter available on the right. By default it is en-US. Try changing it to fi-FI and see how you get the data in Finnish instead.

When observing the data, you quickly notice that not all the data points that our design expects us to have are included there. The wind data is missing, among others. Fortunately, there is another optional parameter called Details. Set that to True and run your request again. You’ll get wind data and several other interesting data points as a result.

You see that the wind data is returned as km/h even though you might be more used to measuring wind speeds in m/s. Let’s worry about that later.
Weather forecast
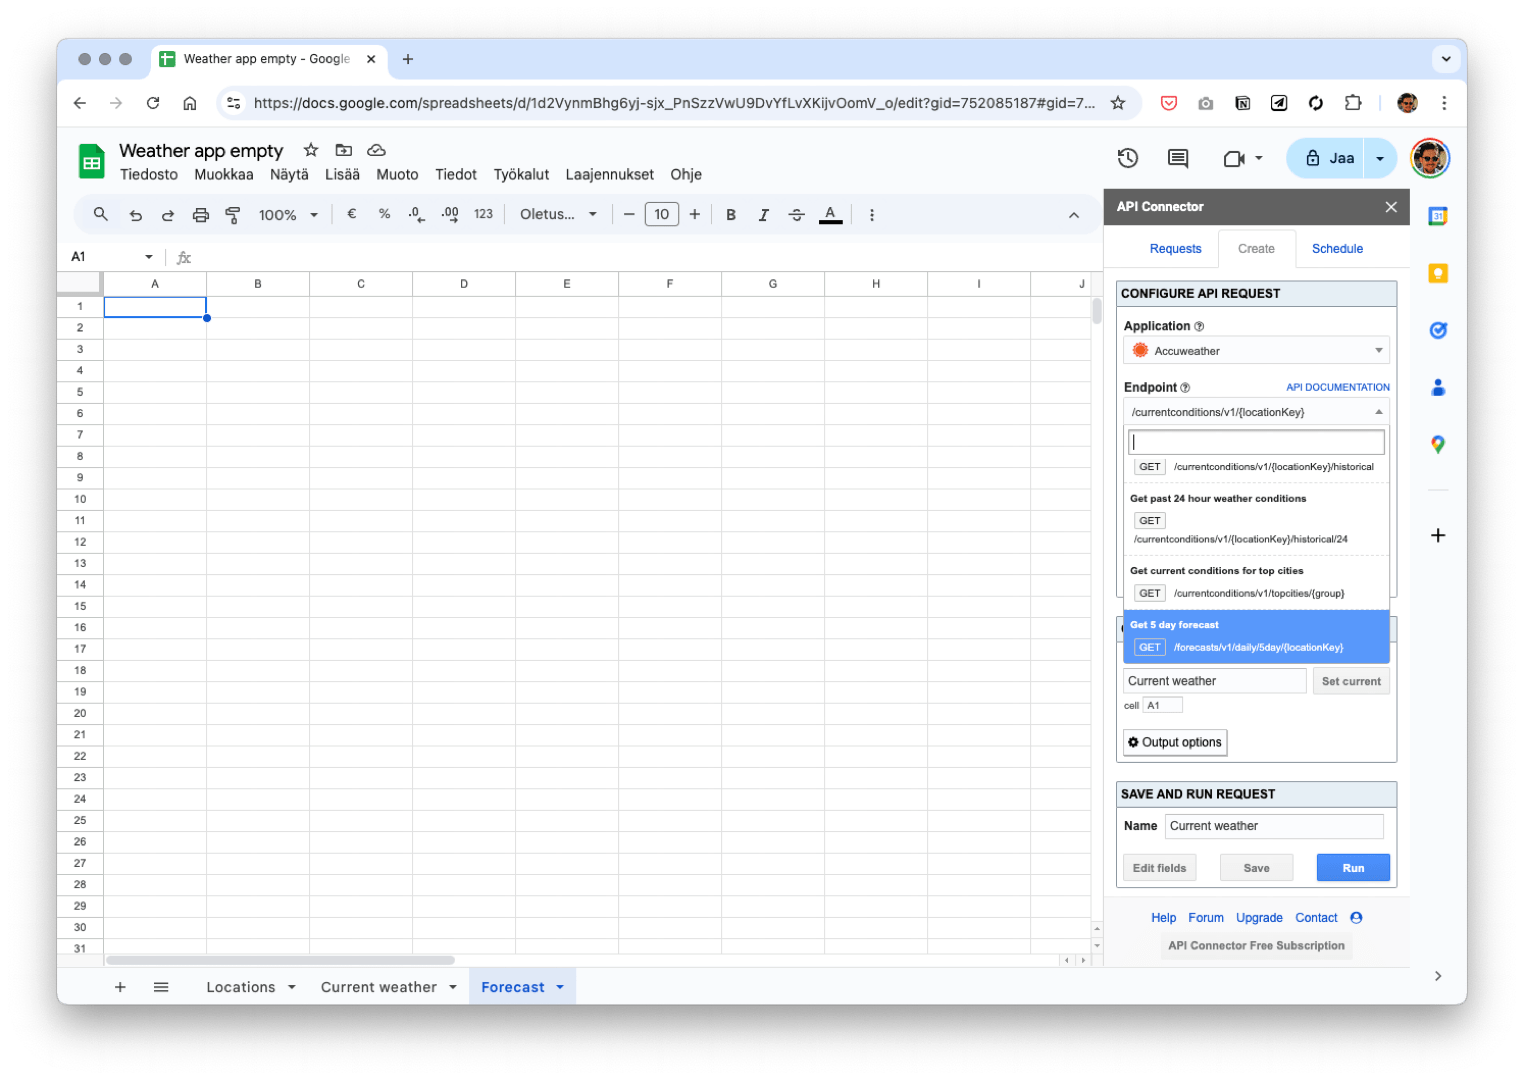
Now that we have successfully fetched the data for the current weather, let’s repeat the process for the weather forecast. Create a new sheet and name it Forecast. Duplicate your previous request and start editing it. Choose the endpoint Get 5 day forecast.
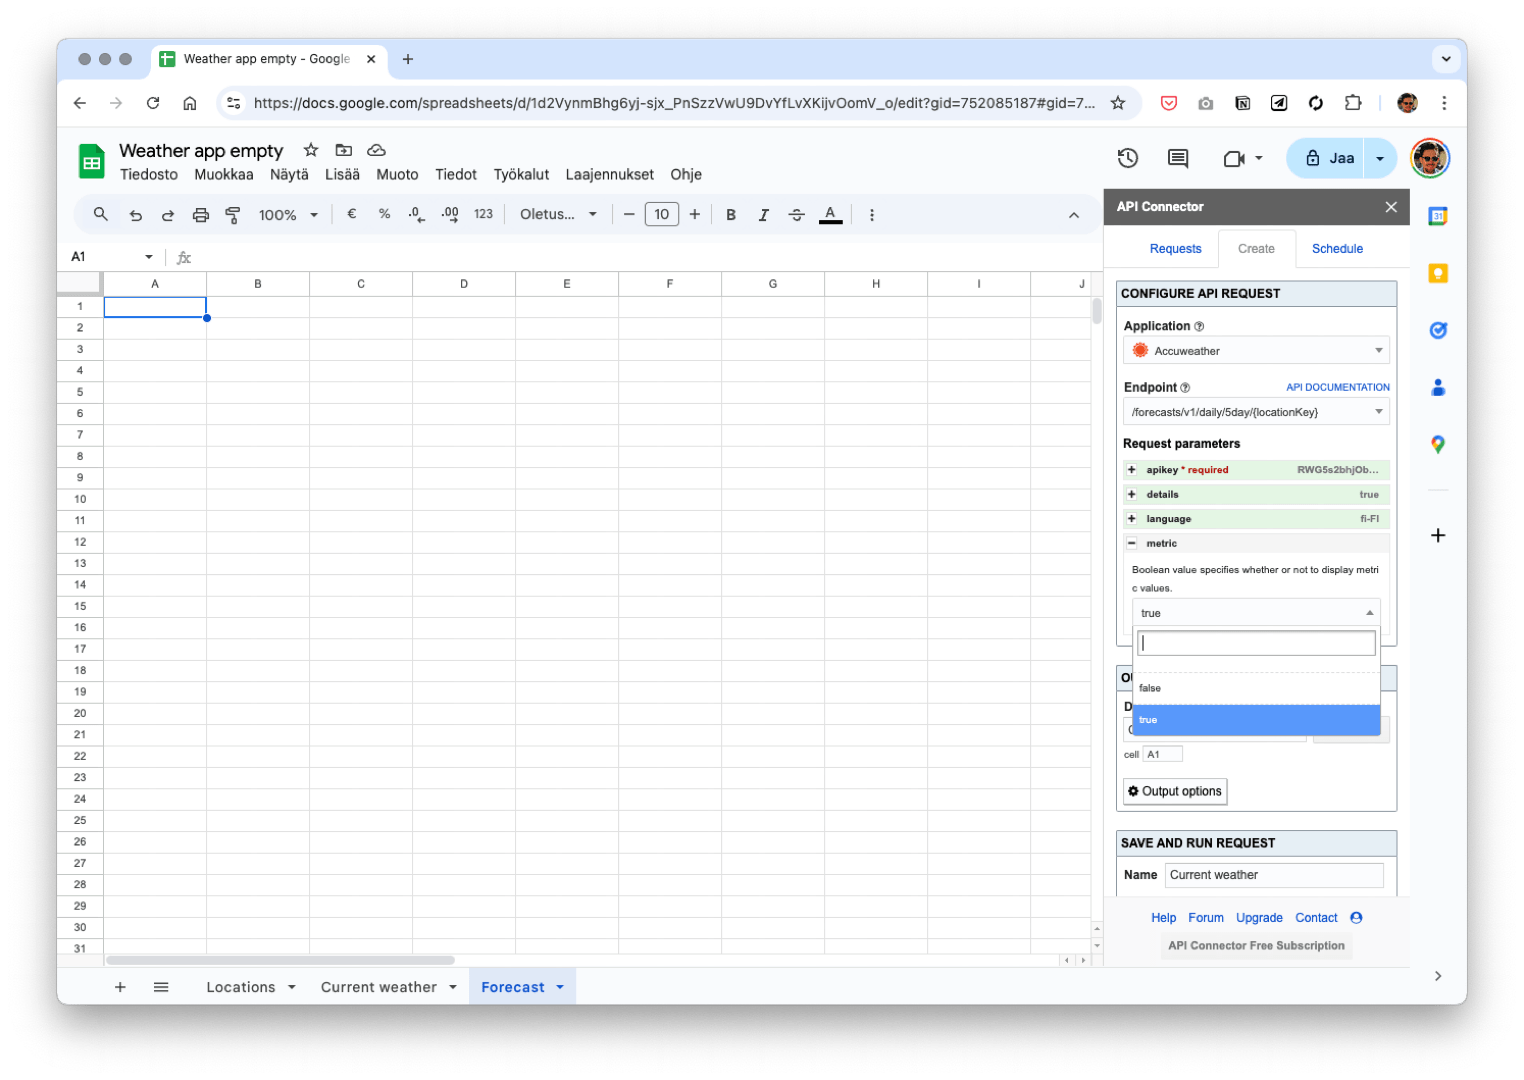
The language parameters and the detailed selection are retained, let’s set the metric parameter true as well. The current weather endpoint used to return both metric and imperial values but this endpoint requires you to choose. Update your target to be this sheet, give the request a suitable name and save and run.
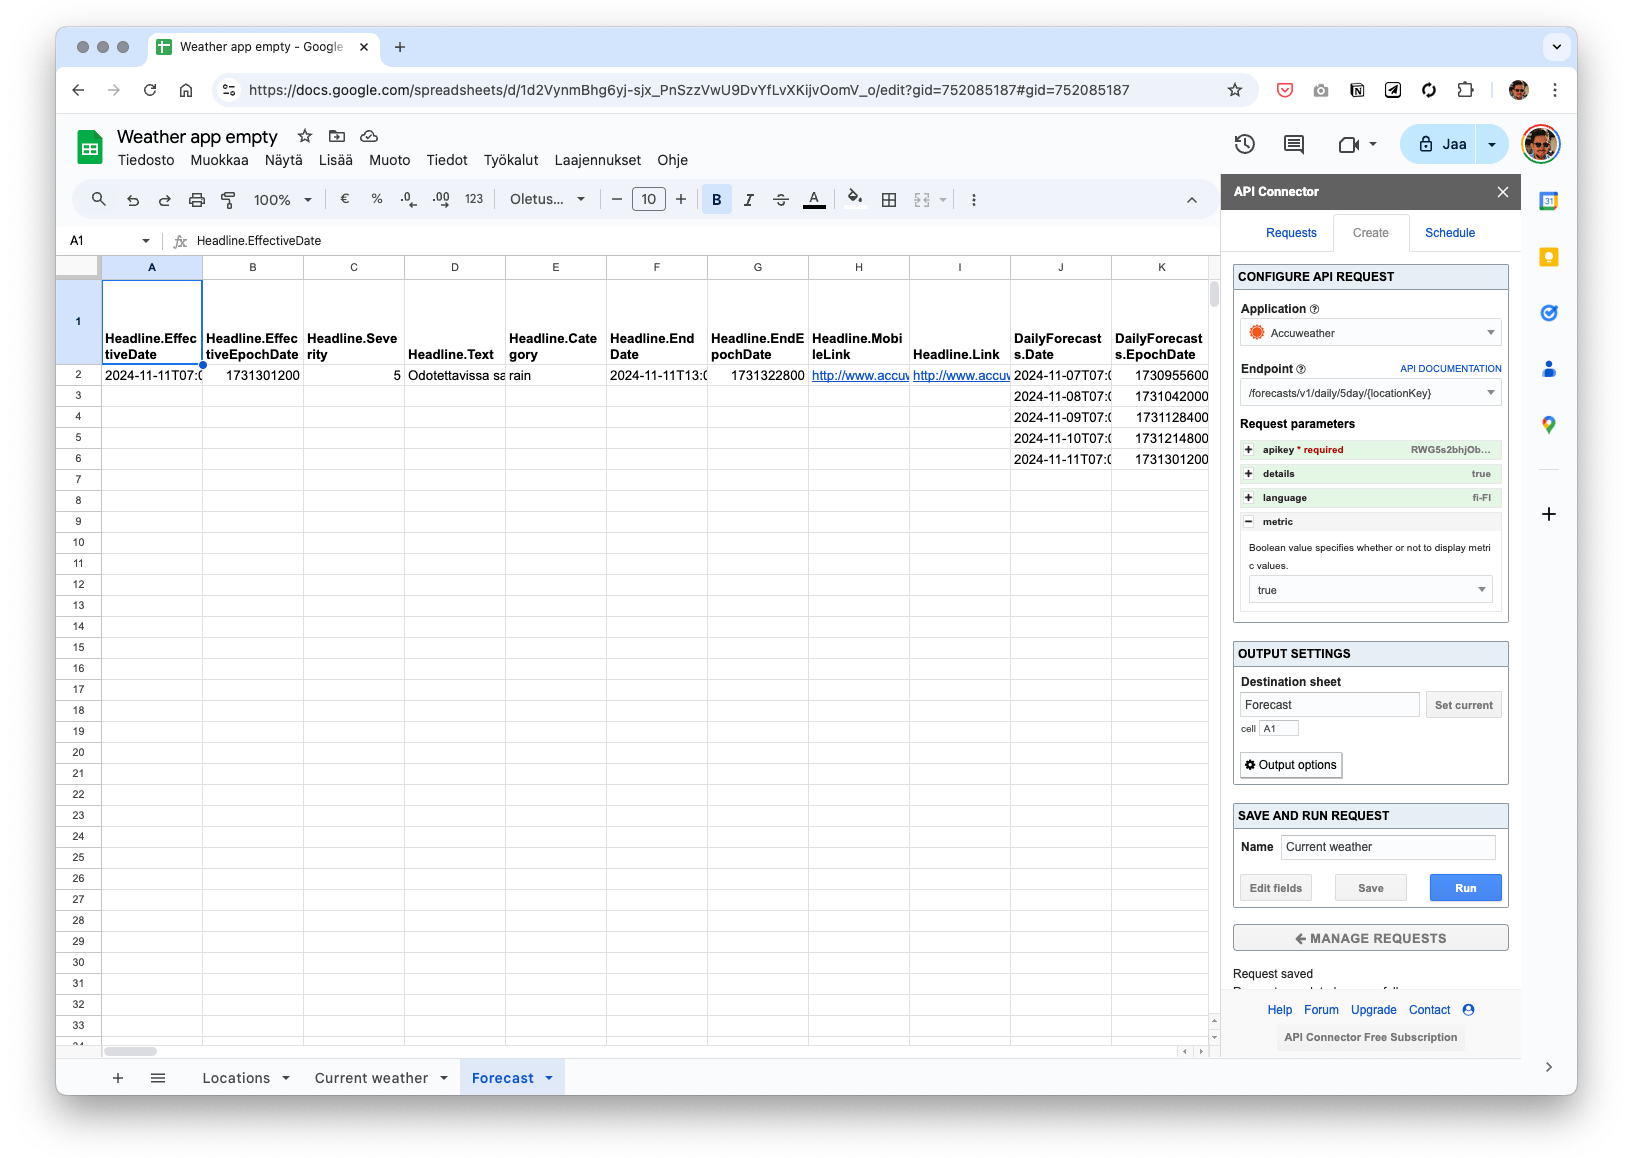
You get the data as expected. This time there are five rows because the response contains the forecast for five days.
We have now managed to fetch all the data we need. Now, let’s prepare it to be shown in the user interface.
Preparing the data in Google Sheets
The following steps are not directly related to either fetching data from an API or importing it to Figma. If you know Google Sheets well, this will all be trivial but since many designers are not that familiar with the tool, this step is included in the tutorial. If you want to skip this, you can open the example document and copy the formulas on the sheet Processed values.
When dealing with data that is fetched with API Connector, I have found it to be a good pattern to create a dedicated summary sheet where all the used data is collected. This is particularly useful in our case, because it’s easier to use a Figma importer if all the data is on the same sheet.
Create a new sheet. In the example, it is called Processed values.
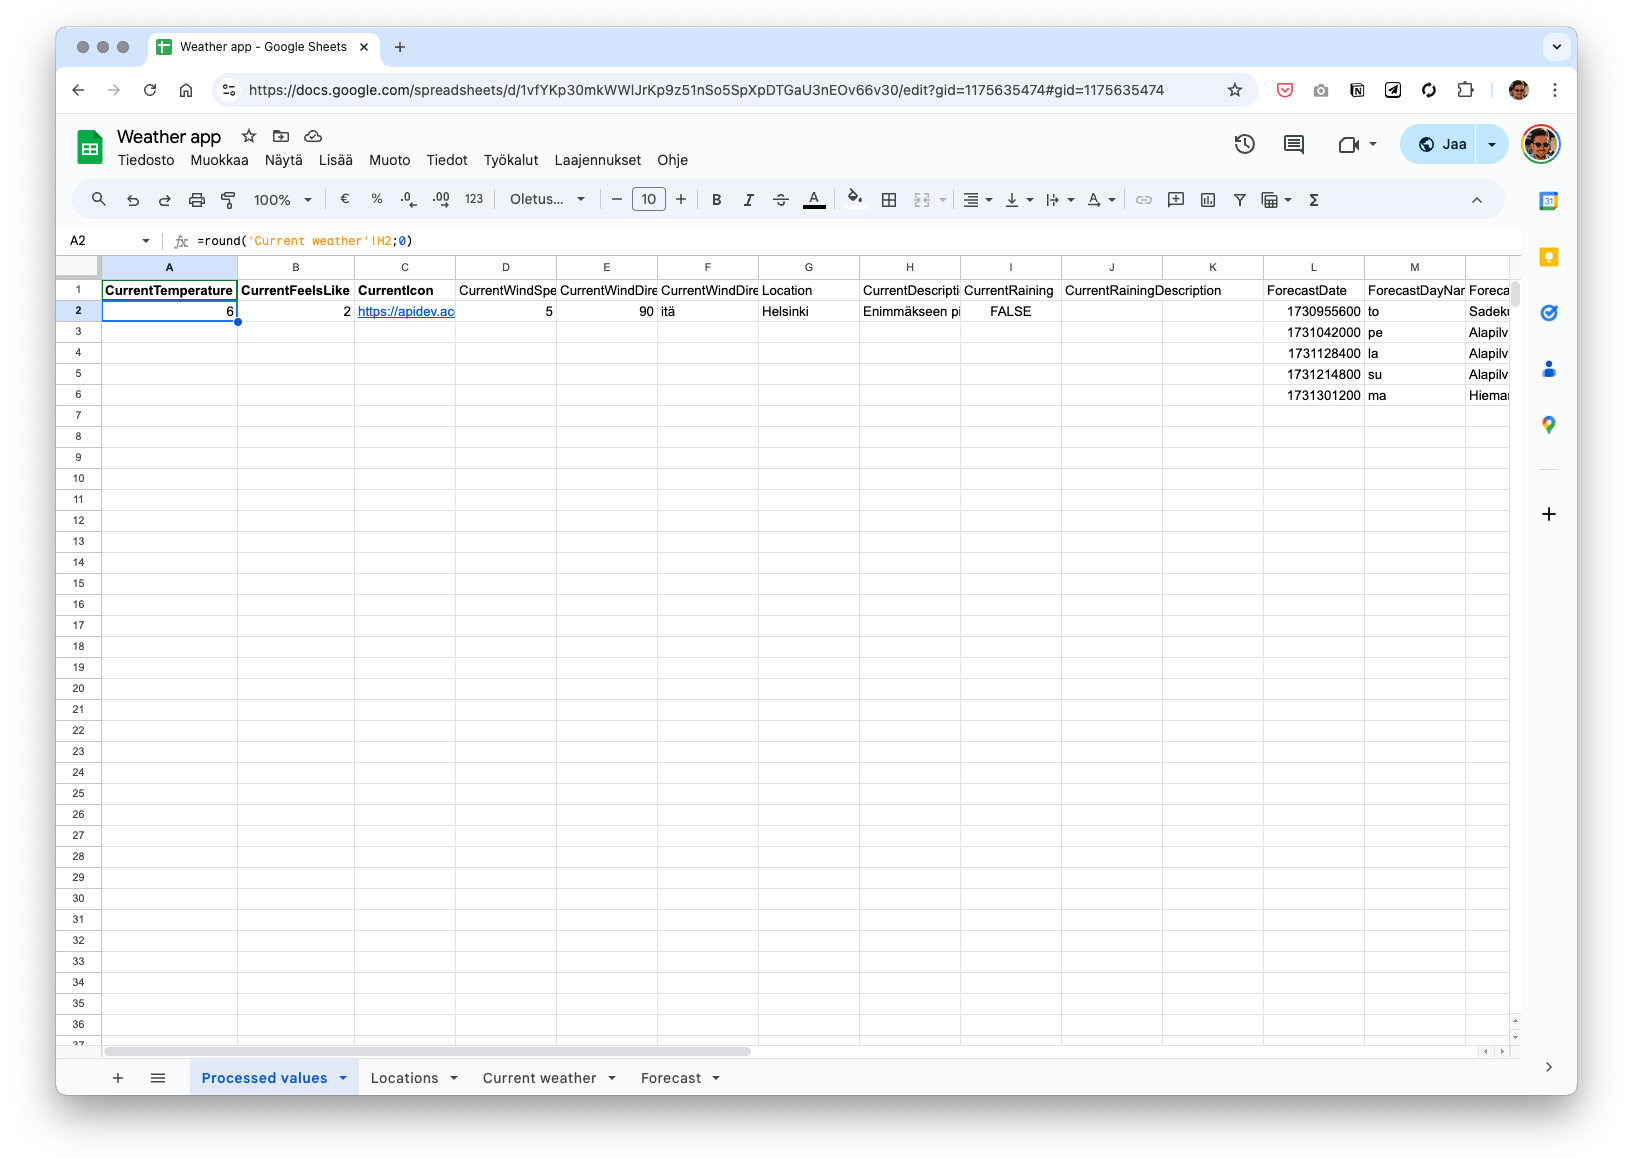
It’s good idea to name the columns with a descriptive name. Don’t use dots in the names (like AccuWeather response does) as that will confuse the Figma importer. Here the logic is that data that is related to the current weather starts with the ”current” prefix and the forecast-related data with ”forecast”, respectively.
Referring to the other sheet
For the most part, you can get the values here by simply referencing the value in the source sheet. Press the = sign to start your formula, click the sheet tab to navigate to the source sheet and tap the correct cell there. Or type the sheet name in single quotes and use a question mark as a separator, followed by source cell coordinates.
Rounding the values
We want to display our temperature data as integers. You can easily get rid of decimals by using the Round formula. The parameter 0 means that there should be no decimals shown.
Hence the formula for getting the current weather is
=ROUND('Current weather'!H2;0)The ”feels like” temperature works the same way.
Generating the links to the weather icons
To get the link to the correct weather icon requires some further investigation. The API endpoint returns the icon as a number code, e.g. 14. By googling ”accuweather icon id”, you can find your way to this page where all the icons are presented. They explicitly warn you not to link directly to these files because the URLs may change but for our little exercise, it works just fine.
If you open an individual icon in a new tab, you can see that the URL is of the syntax:
https://apidev.accuweather.com/developers/Media/Default/WeatherIcons/14-s.pngWhat you need now is a Google Sheets formula that returns you the URL based on the icon ID in the API response. One quick jump to ChatGPT and you have a working formula:
="https://apidev.accuweather.com/developers/Media/Default/WeatherIcons/" & TEXT('Current weather'!D2; "00") & "-s.png"Converting the wind speed to m/s
The API returns the wind speed in km/h. To get it to m/s, simply divide it by 3.6 (1000 meters in a km and 3600 seconds in an hour). Again, to round it, use the Round formula.
=round('Current weather'!AO2/3,6;0)Getting the textual value for wind direction
The API returns the wind direction in degrees, in English abbreviations and in broken Finnish terms that are sometimes abbreviations and sometimes not, depending on the direction. Clearly, the values we get from the API are unusable, so we should create our own.
If you ask nicely, ChatGPT will give you this formula that converts degrees into verbal directions.
=IFS( OR(AND(E2 >= 337,5; E2 <= 360); AND(E2 >= 0; E2 < 22,5)); "pohjoinen"; AND(E2 >= 22,5; E2 < 67,5); "koillinen"; AND(E2 >= 67,5; E2 < 112,5); "itä"; AND(E2 >= 112,5; E2 < 157,5); "kaakko"; AND(E2 >= 157,5; E2 < 202,5); "etelä"; AND(E2 >= 202,5; E2 < 247,5); "lounas"; AND(E2 >= 247,5; E2 < 292,5); "länsi"; AND(E2 >= 292,5; E2 < 337,5); "luode" )It’s not as messy as it seems. What it does, is it splits the 360 degrees in the compass into 8 sectors and assigns them the correct names.
Reacting to rain
The API tells us if it is raining by returning either True or False in the variable HasPrecipitation. We want to react to this in the UI by showing an umbrella icon and changing the variant of our hero component accordingly.
To prepare for this, let’s do the following. Let’s get the orignal True/False value in column I with the formula:
='Current weather'!E2For the column ShowUmbrella, use this formula:
=IF(J2="rain"; "/Show"; "/Hide")
This is the standard If formula that first checks a condition and then returns the first value if the condition is true and the other value if it is not. The column J2 contains the type of the rain. So, we only want to show the umbrella icon when it’s raining water and not when it’s e.g. snowing.
BTW, if the formulas don’t work, it may be connected to your language settings. If you are using Google Sheets in Finnish you should use ; instead of , as the separator and a comma as a decimal point, not a period.
And for the column Hero, use this one:
=IF(I2=TRUE; "Type=rain"; "Type=sun")The column I contains the value for if it’s raining at all. The idea in this example is that for simplicity, we only have two states in the app hero image: Rain and Sun.
The syntax /Show and Type=rain are Figma-specific things that will be explained soon.
Extracting the day of the week
That was all for the current weather data. The forecast works the same way but adds one extra thing we need to address. It would be useful to display the name of the day in our forecast list but the API does not return the value. Instead, we get a timestamp in year/month/day format and as a weird string of numbers.
Turns out, the latter is something called the epoch time or Unix time. It tells us how many seconds have elapsed from the 1st of January in 1970. We can turn that into the day of the week with this nifty formula.
=TEXT(DATE(1970;1;1) + (L2 / 86400); "ddd")Yes, I did not come up with this formula by myself. Let’s let the creator ChatpGPT explain themself how it works.

The rest of the Forecast data fields work similarly to the Current fields, with the only exception that there are five rows of data, so make sure to copy the formula accordingly to reveal all the rows.
After this tinkering, we’re ready to move on to Figma.
Importing the data to Figma
You can use the shared Figma file to get started.
I know it doesn’t have auto layout and responsive design. It’s mostly due to me being a bad person. My excuse is that I’m waiting for the time when machines take care of stuff like this – like they should.
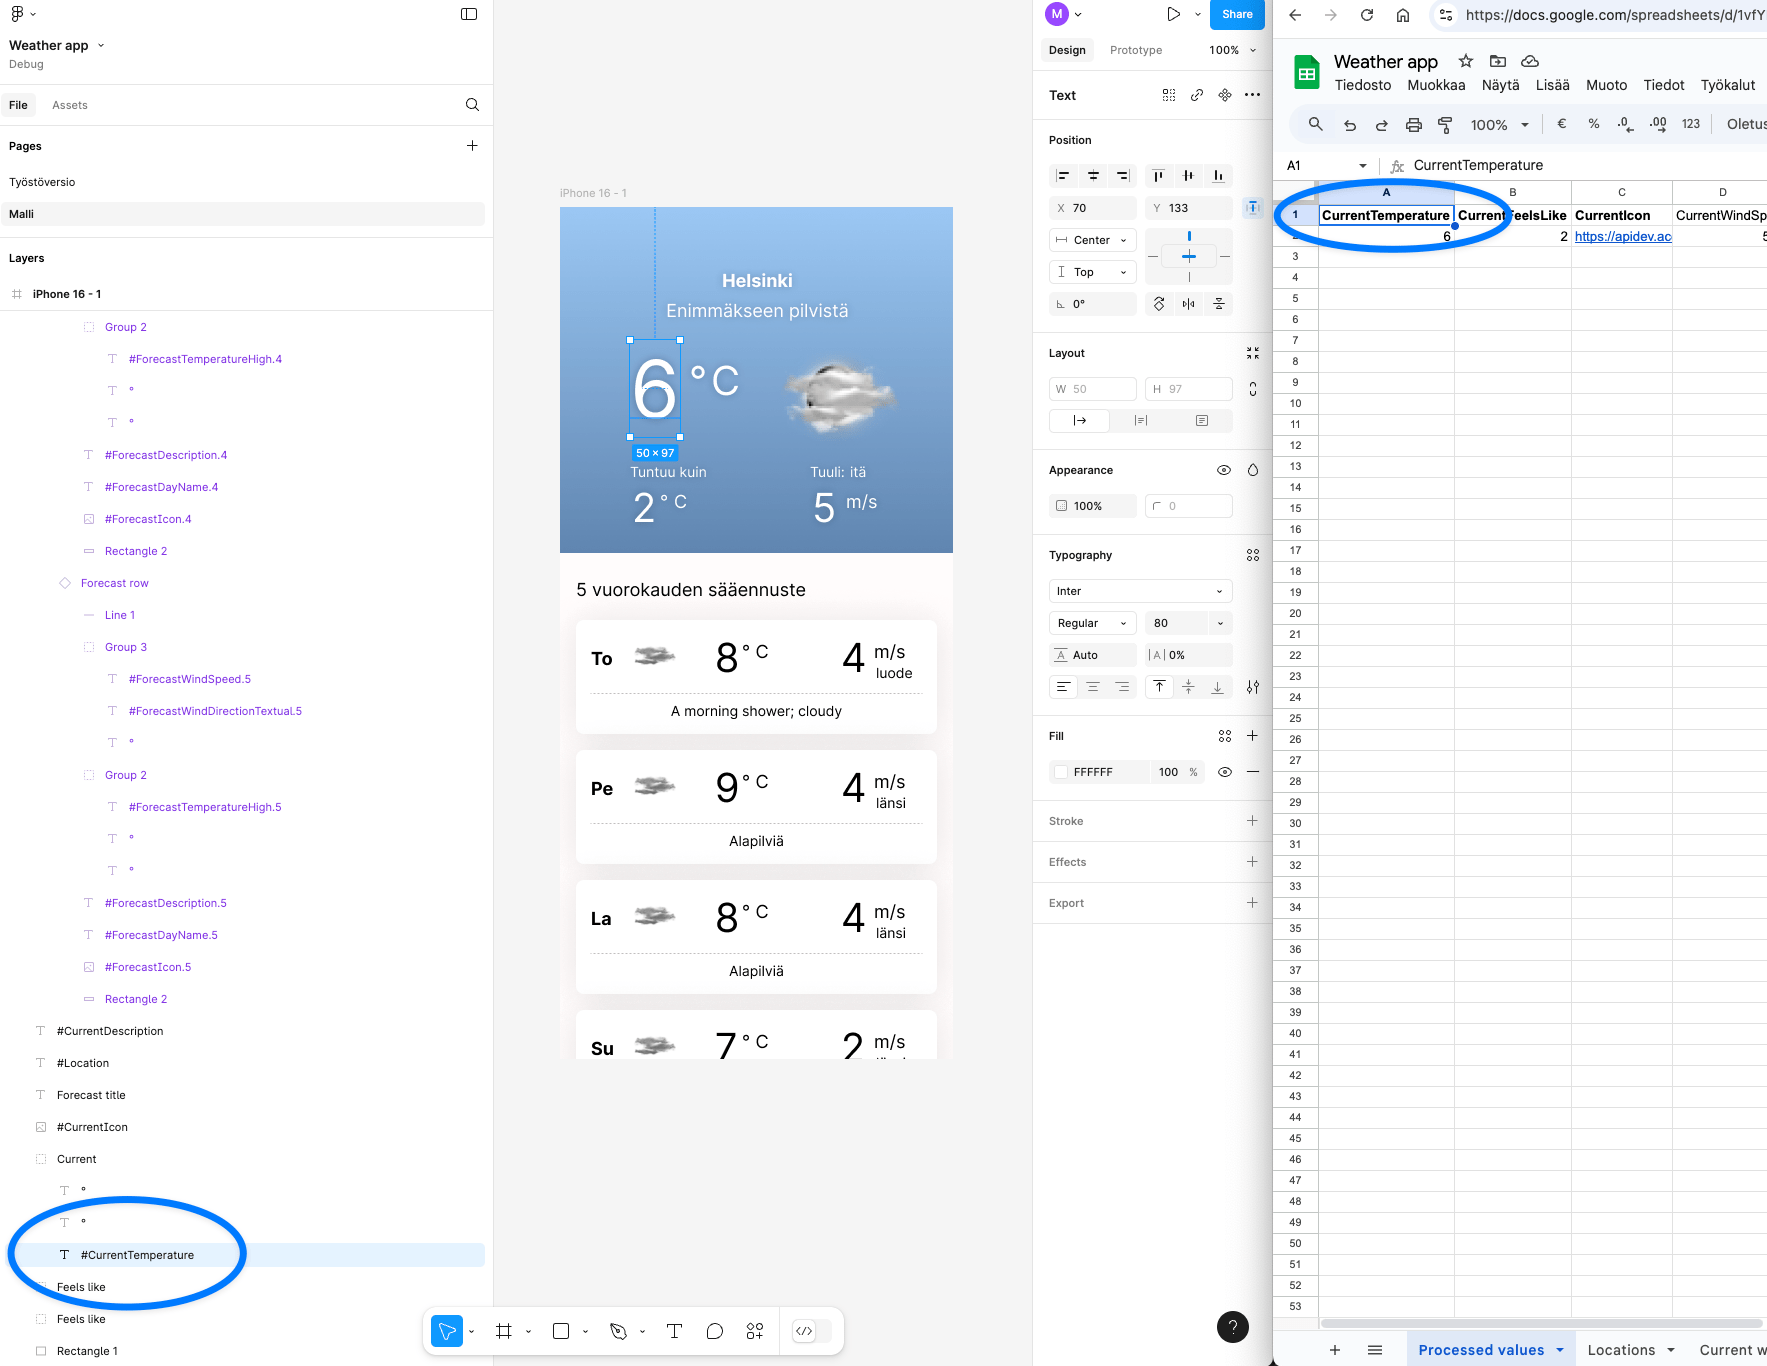
To attach values in the Figma file to the values in the Google Sheet, let’s use a simple syntax. Name the layer with the same name you use as the title for the Google Sheets column and add a # before the name. So, what is CurrentTemperature in Google Sheets becomes #CurrentTemperature in Figma. It’s as simple as that.
Launch the Google Sheets Sync plugin and copy your Google Sheets share address there to set up the connection (make sure the Sheets file is shared so that anyone can read it).
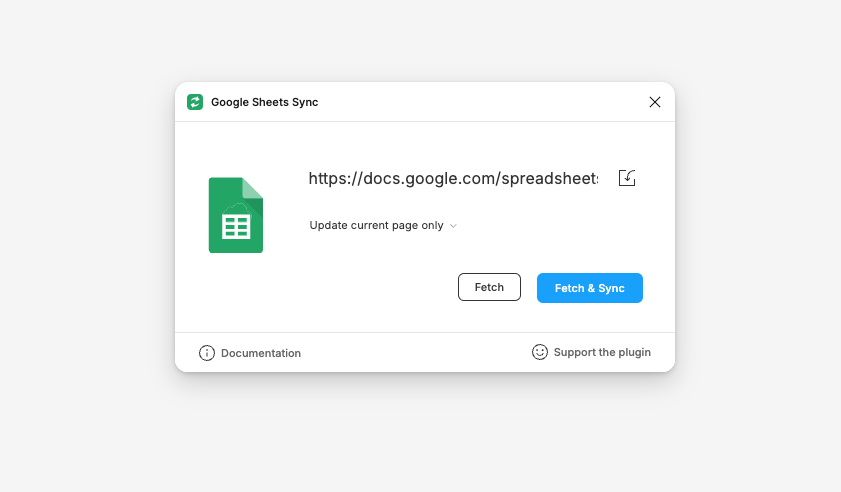
Press Fetch and Sync and observe how values get updated with the values in the Sheet.
It’s pretty cool that even the icons work just like that. The original graphics are of low resolution, though, so especially the hero area looks a bit messy.
Importing values from different rows
Ok, it gets a bit more complicated than this. The forecast list has several values with the same title in Google Sheets. To reference these values, you need to add a number to the end. So the value for the first day is ForecastTemperatureHigh.1 and for the second one it is ForecastTemperatureHigh.2. So, the indexing starts at 1 and not 0 like typically in coding.
Showing and hiding the umbrella
After you get the basic data fetching to work, you can switch to the Advanced page in the Figma file. This page has some added functionality, namely showing the umbrella when it rains, changing the hero to Rain variant when it rains and animating in the forecast when the prototype is loaded (nothing to do with data fetching but just wanted to try it out).
The umbrella is a component with two states which creates the appearance animation, intended to grab the user’s attention. The component is included in the main view directly and named #ShowUmbrella. However, in Google Sheets we do not have textual value for this but rather either the value /Show or /Hide. Figma reads this value and acts accordingly, only displaying the component when it has the value /Show.
This is an easy way to attach the visibility of a component to a value in Google Sheets.
Showing the rain variant of the hero
You can also combine Google Sheet values with object variants. In the Figma file the hero component has two states: rain and sun. The column in Google Sheets is called Hero and the value there corresponds to the naming of the variants.
Hence the ”Type=rain” in the Google Sheets document.
Unfortunately, it seems that Figma doesn’t let you update variable values from Google Sheets. Please let me know if you figure out a way or a plug-in that does this.
Learning more about the Google Sheets Sync plug-in
The Google Sheets Sync plug-in has pretty extensive documentation that also links to example Figma and Google Sheets files. However, I found some of the documentation hard to understand as it lacked concrete examples of working syntax. There are some useful things described there that I didn’t get to work on my first try.
And I’m bad at trying again.
Bonus: using auto layout to create an appearance animation
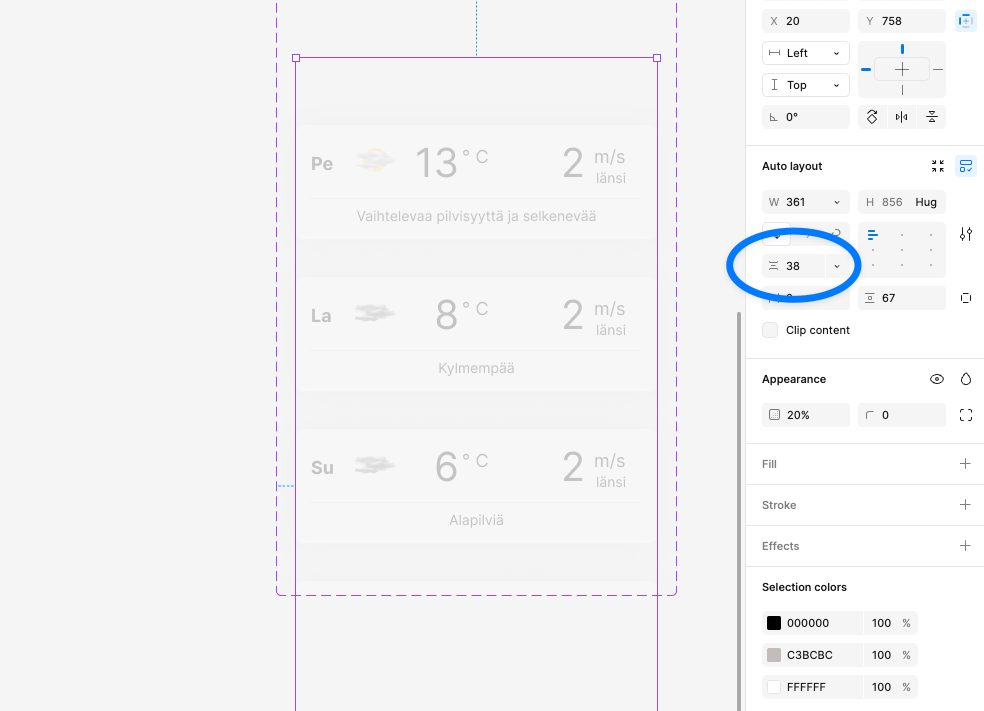
This has nothing to do with fetching data from the API but when putting together the Figma template, I came up with a simple way of creating a little list appearance animation. If you create two variants of your list and change between the states after a short delay with Smart animation, you get a nice effect for free by just dragging the gap of your list auto layout.
Closing thoughts
This tutorial teaches two useful skills:
- Fetching data from APIs with API Connector
- Populating data to Figma from Google Sheets
These can be connected like shown here but they’re useful individually as well. One good use case for the API Connector is creating sales and marketing dashboards with Google’s Looker Studio. In theory, many services provide direct connections to Looker Studio but there are limitations what you can do with these. Further, certain data operations are easier to accomplish in Google Sheets than in Looker Studio, so I have found it useful to collect data from different sources to Google Sheets and then pull the data from there to Looker Studio.
I’ve displayed data from services like Google Analytics, Meta ads, ActiveCampaign CRM, Cal.com booking service, Typeform survey tool, Zendesk customer service tool, etc. If you get the paid version of API Connector you get rid of certain limitations and can also schedule requests to happen automatically.
If you’d like to know more about this, let me know. I might create a Looker Studio tutorial later.
When it comes to populating data from Google Sheets to Figma, it may be useful even if you don’t connect it to any APIs. For example, if you want to experiment with copy variations, different localizations, or all in all externalize content production outside your design team and not get Figma licenses (and training) to all contributors. The example Figma files by Sheets to Figma will give you ideas on how to set this up.
